Isosurfaces
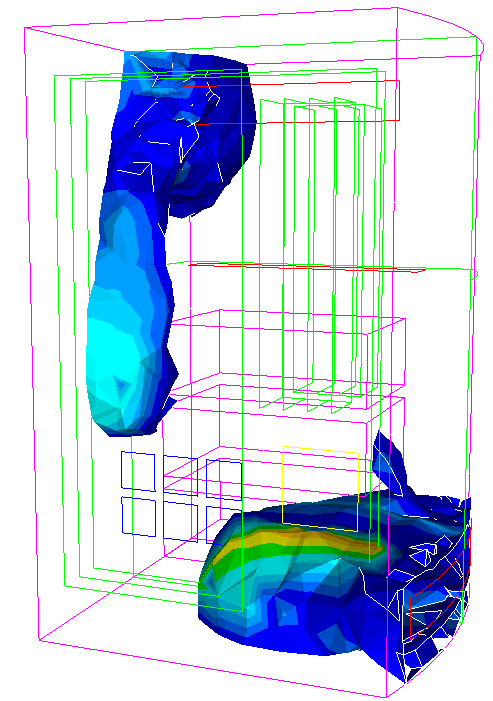
An isosurface is defined as an area with a constant value (e.g. pressure, temperature, velocity, density) within a volume of space. It is the 3D equivalent of a contour line.

Isosurfaces are normally displayed using computer graphics, and are used as data visualization methods in computational fluid dynamics (CFD) and finite element analysis (FEA). Isosurfaces are a three-dimensional visualization tool that show a value as well as the physical shape of the flow characteristics. They are useful for visualizing velocity distributions in complicated flow paths as well as temperature distributions in thermal simulations. You can also use isosurfaces to determine the locations of the maximum and minimum values of a quantity.
Isosurfaces may be derived based on any scalar result. In addition, another scalar result can be mapped as fringes onto the isosurface, showing for instance the variation of temperature over a surface of Constant pressure. The isosurface also allows for vector result mapping.
Any number of isosurfaces can be defined and displayed, and various display attributes can be set separately for each one, for instance:
Visibility
Highlighting
Draw style
Result mapping
fringes
contour lines
vectors
See the class documentation (Isosurface) for a full list of display attributes.
Isosurfaces are created and accessed from UnstructGridModel.
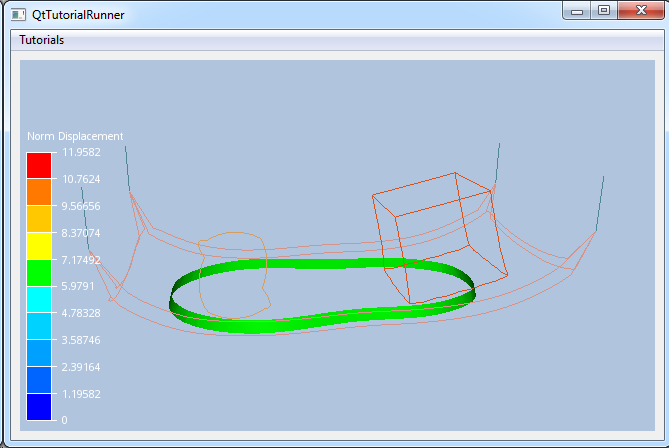
Tutorial
UnstructGrid: Create an Isosurface |
See also

